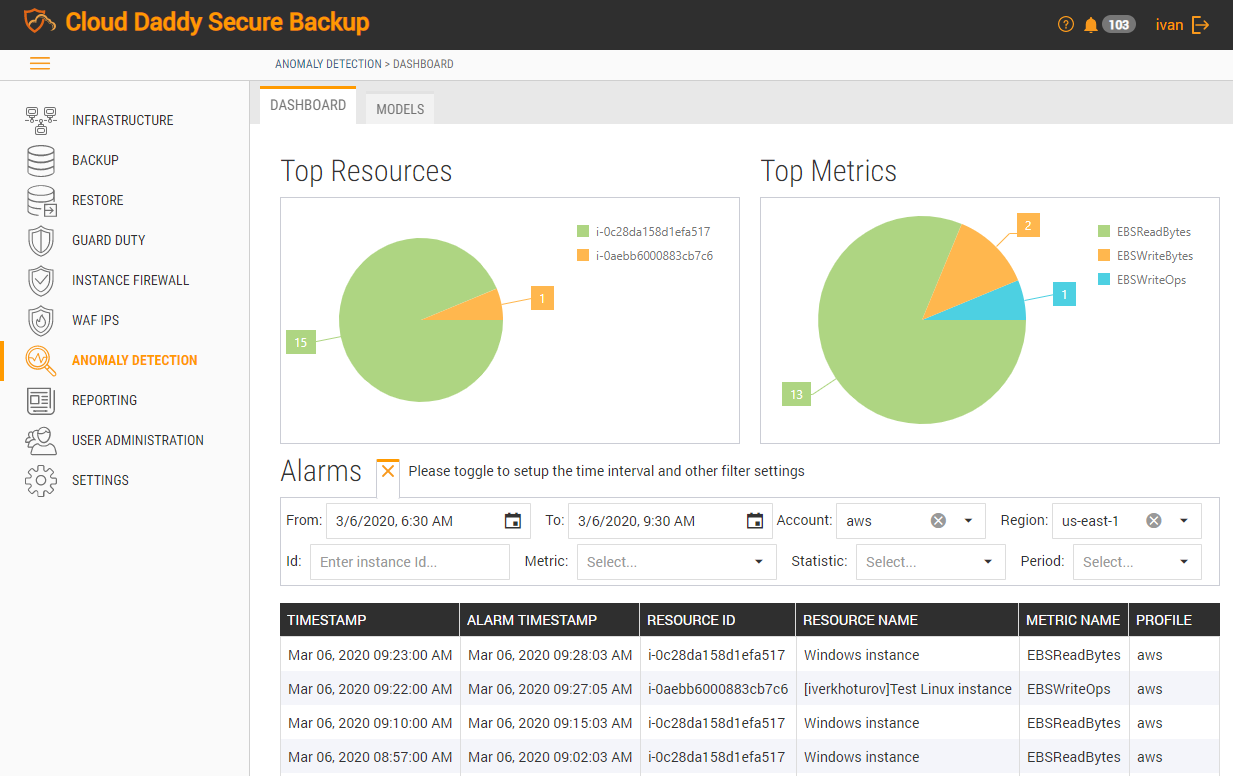
Using the Anomaly Detection Dashboard you can easily see statistics related to alarms as well as an easy reference geo-location map with alert locations, top resources and top metrics diagrams.
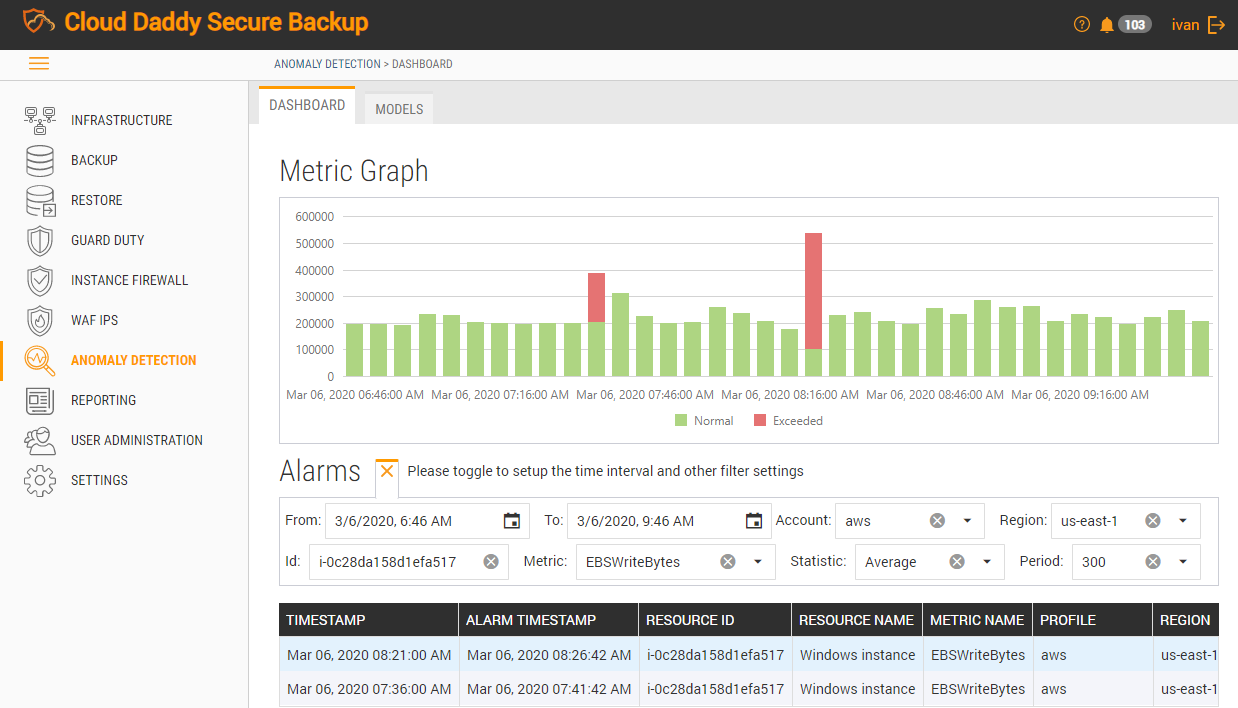
Metric graph
You can see the metric graph, for this, right-click on the alarm and press filter by this resource.
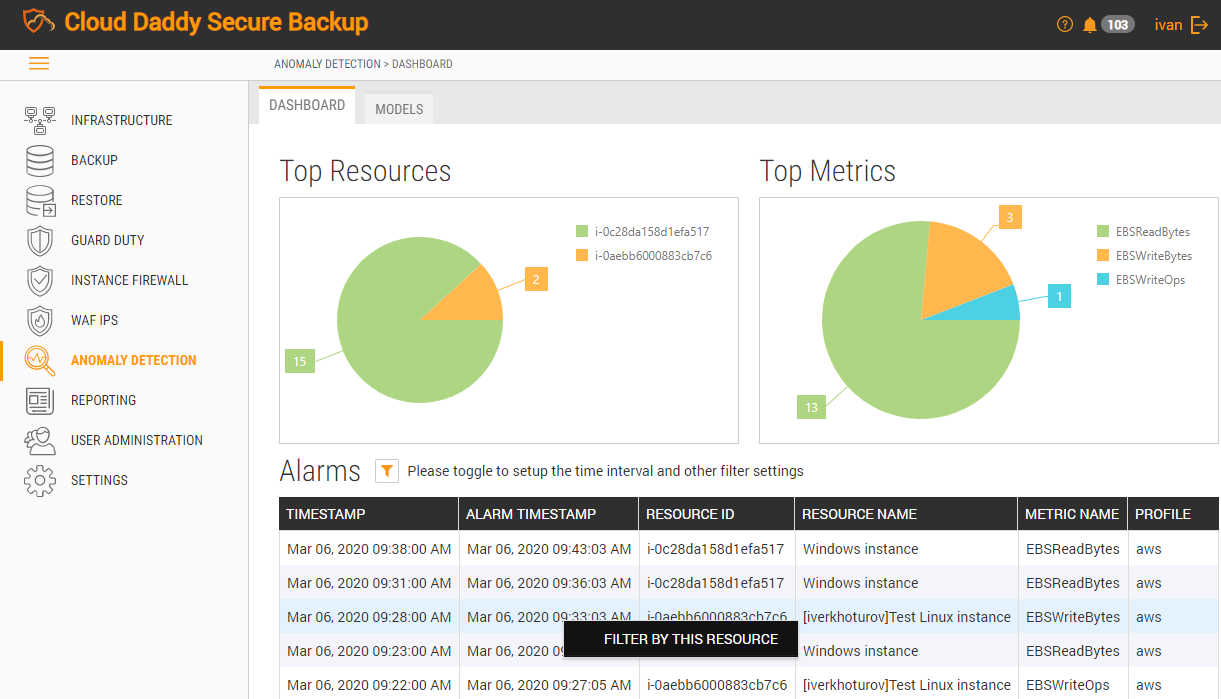
The result of the action metric graph will be reflected.